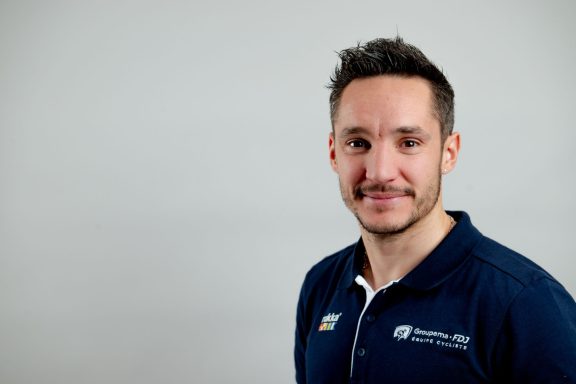
In October 2021, the Groupama-FDJ cycling team’s performance department equipped itself with a new asset: a Data Scientist. After a few missions as a service provider, Olivier Mazenot has indeed joined the organization to provide very specific skills. He tells us more in this interview.
Olivier, can you explain to us your role as a Data Scientist within the team?
On a day-to-day basis, I’m on my computer, and I mainly program in Python Language, which is the one used by many Data Scientists to process data. My first task is to organise the data collection, sorting and analysis, which is no mean feat as we have a lot of it. All this data is centralised on the team’s platform, and we have created a whole ecosystem to be efficient in analysing it. My second mission is precisely the statistical analysis of the data, which essentially come from the riders’ GPS counters, with a major data that is power, expressed in watts. We also collect other data, such as blood sugar levels during training camps. As for the analysis, there are descriptive statistics on the one hand, and statistical models on the other, which in addition to explaining the data have a predictive function. The two combined make it possible to better understand and analyse the data. My third mission is the creation of applications so that the work of the first two missions is operational and usable by other people, mainly coaches. Coaches already use many websites and software, but we also need specific tools for a professional team like ours. I have created an application where they can cut training sessions and calculate the associated statistics. This makes it possible to automate data processing.
“We don’t lack ideas in the team’s performance department”
Are you eventually here to make other people’s life “easier”?
The goal is indeed to save time. With the application, for example, the idea is that the coaches load the files, click on a button, and that the site provides them with the graphs, the cuts, and the calculation of the statistics almost instantaneously. For example, a session of “Maximal Aerobic Power” with repetitions of 30′-30” series involves a lot of cutting. If the programme does its job as it should, it’s done instantly, whereas it used to take the coaches about ten minutes, even if they were used to doing it. On a training day when a coach’s 7-8 riders are doing this exercise, you realise that the programme can save precious time. One of my main missions, and one of the reasons I was hired, is definitely to help coaches save time on certain repetitive tasks. When you program, you can also do the analysis you want, especially on all the riders’ data over several seasons. For example, we studied the evolution of the riders’ pedalling profile. By cross-referencing several variables such as power, pedalling rate or terrain data, the statistical analyses allow you to point out variations over time with the riders, in order to come to conclusions such as: “the more the seasons pass, the more this rider tends to turn his legs quickly”. In this way, we can obtain an overview of all the riders in the team. For the coaches, it is also interesting to compare the riders with each other.
Can you tell us more about the making of this application?
I’m originally a maths teacher, and when you’re a maths student, you also do a bit of computer science, you learn to program. This being said, three years ago, I didn’t know all the tools I’ve used to create this program. I’m pretty self-taught in that respect, but that’s also how it works in computer science. When you have a taste for it, you learn quickly, you do some tutorials on the Internet, and you learn to get used to a language. Today, the core of the program is finalized, but we can always add new features. Like any software, it can always be improved. In the team’s performance department, we don’t lack ideas to improve the monitoring of training.
“One shouldn’t believe that artificial intelligence will revolutionise everything right away”
Is there a specific concern about how to present statistics?
When you create statistics, the first version of the graphs is usually not very pretty, not very readable. There is a lot of work to be done in terms of simplicity and aesthetics, so that the curves and diagrams are understandable. The guiding idea is that the coach’s or the rider’s eye can go straight to the point. It is a bit of a hidden job, but it is important so that the result is readable, simple, and nice. Graphs take many forms: there are curves of course, but also bar charts, histograms, pie charts and many other geometric shapes… There are many ways to represent data. The job of the Data Scientist is to find the simplest and most effective way to make it do the talking. A data table is often difficult to read. It is difficult to see the different orders of magnitude between the numbers. The purpose of graphs is to highlight these differences. I still have some work to do to represent training statistics graphically.
How can artificial intelligence be used in a cycling team?
When we talk about “data” nowadays, we can’t avoid mentioning artificial intelligence. This is a large field that includes, among other things, Machine Learning algorithms. In very simple terms, these algorithms “learn” from the statistical power of large databases to then make predictions. Let’s take a climb, and ten thousand riders who have done it, with their physical characteristics, their power level, the weather conditions, etc… If we add a new rider who has not yet done this climb, we will be able to predict his climbing time, knowing his profile, his current shape, and the day’s weather conditions. The more relevant data we have, the more accurately we will be able to predict his climbing time. When I talk to other data scientists, some of them think that I use a lot of Machine Learning algorithms, as is the case in other fields. But in fact, I don’t do much of it at the moment. Not that I lack ideas, I have plenty, but it’s more a matter of priorities, and time! This doesn’t mean that artificial intelligence won’t be used by the team in the future. It could bring a significant benefit for recruitment or real-time race strategies for example, but one shouldn’t think that it will revolutionise everything right away. Some performance factors are also too chaotic to be easily taken into account. I’m thinking of the wind, the race scenario, and the rider’s shape.
“I also have my part to play”
How rich is the database you were talking about?
Lately, I took a bit of time to calculate the order of magnitude of the number of data that we can collect during a year, counting our forty riders, Conti and WorldTour teams together. The training and race files give us approximately 2.5 billion numerical values per year. That’s about the number of seconds in a human’s life! It’s quite staggering. The data also allows us to go back in time. For example, if we want to know Arnaud Démare’s performance in all his Milan-Sanremo, it’s easy and quick if the database is well managed. On the other hand, it can be very time-consuming if you have to search for files one by one in folders. Our database allows us to follow the evolution of our riders, and some of them over their entire career.
How many variables or parameters cover these “2,5 billion numerical values” per year?
If we stick to the variables given by a power metre every second, there are between fifteen and twenty variables, but not all of them are equally important. There is pedalling data: power, pedalling rate, right leg/left leg balance, and other more technical data. There is also positioning data: GPS coordinates, altitude; as well as temperature, heart rate and other more anecdotal data. In addition, there are also perceptual variables. Every day, the rider gives a score from 0 to 10 on his feelings of performance, struggling and sleep. These perceptive data are also very important. From the power data, we also calculate the power records of a rider for different durations. It goes from one, five, ten, twenty seconds, etc… up to five hours. This is also crucial data that allows coaches to know what level their riders have, with information such as: “today, in the final climb of the race, the rider was riding at 97% of his one-minute record from two years ago”. This type of information, put into the overall context of the race (difficulty, weather, fatigue of the previous days), provides excellent reference points for the rider-coach duo.
What is your relationship with the riders?
I am not in contact with the riders on a daily basis, but there are two or three exceptions. Valentin Madouas, for example, is doing his end-of-study internship with me. The aim is for us to discuss what I do and for him to give me his rider’s eye, which is different from that of the coach, but which is very interesting for me. I process the data, but I don’t live it. Talking about it with a rider like Valentin is a real benefit. I also worked specifically on Stefan Küng’s time trial data. He is a very intelligent rider who has a very fine analysis of his data. He is meticulous and it is no coincidence that he is at the level he is. I also had the opportunity to show what I was doing to the Conti riders in Besançon, and to other WorldTour riders in training camps. Everyone is more or less interested, but it’s always interesting to talk to the riders. It also allows them to see what is done internally, and we do a lot of things. The performance department is very active. Just like those who work in Villepinte at the administrative level, I am a worker behind the scenes. I’m not going to be seen at the races, but I also have my part to play and my contribution to make.


No comment